In the last few posts I’ve introduced you to the concept of dynamic ocean topography (DOT) and what causes it. In this post I’d like to introduce you to one of the global models or estimates of mean DOT and explain a little about how it was made.
DOT can change daily which makes it difficult to precisely measure over large areas like the face of the earth. Instead, to observe DOT on large scales, measurements are repeatedly collected at regular intervals over the entire area. Think of trying to measure the growth of a field of wheat. It would be an extremely large task to measure every stalk of wheat every day. A more reasonable approach would be to take an average height at several of the same locations every few days. This is generally how these large global models are made.
The intricately named MDT_CNES-CLS13 is one such model of mean DOT. MDT_CNES-CLS13 was produced by CLS Space Oceanography Division and distributed by Aviso, with support from Cnes (http://www.aviso.altimetry.fr/). You can see a picture of the model layered over the Google Hybrid map below.
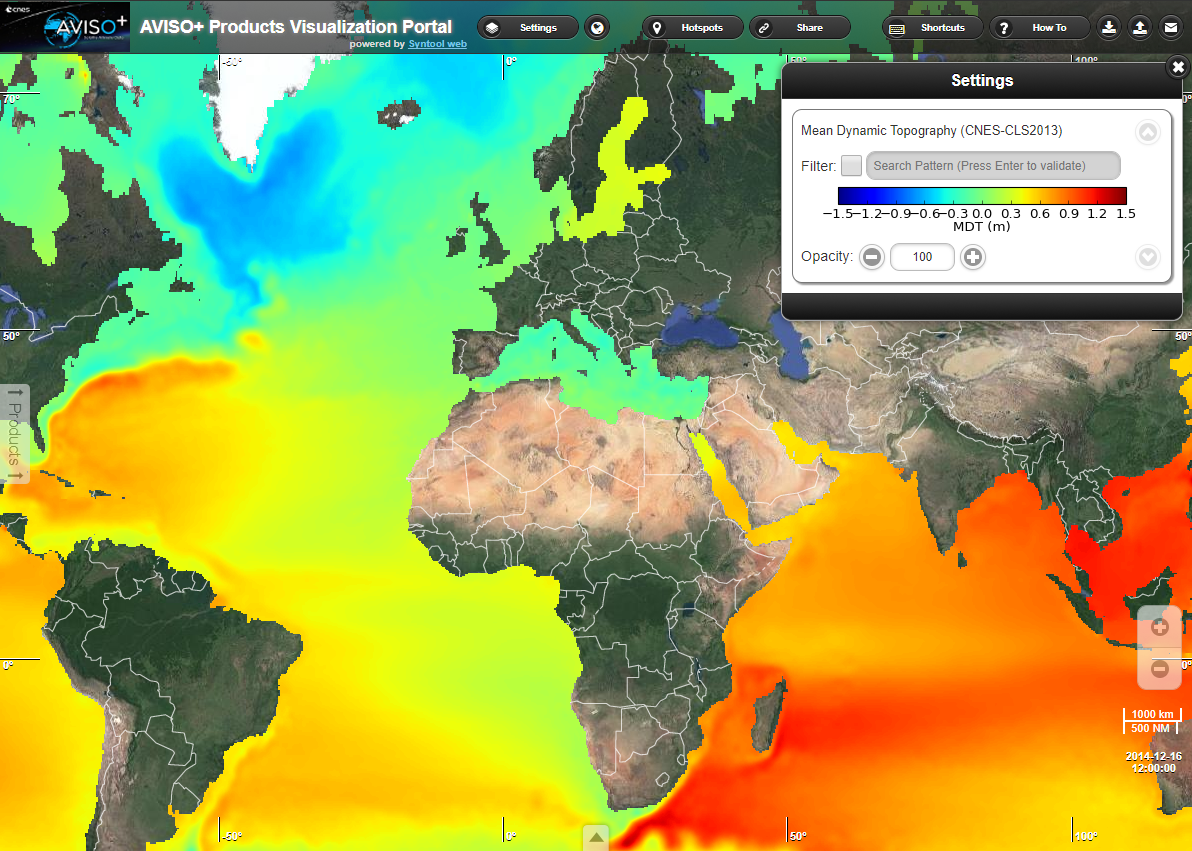
The vertical range of the model is roughly +/- 1.5 meters globally. The effects of the Gulf Stream current, a geostrophic current like we discussed in the first post, can be seen as the red and orange immediately off the east coast of North America. You can also see the Agulhas current off the southeast end of Africa, also very red. You may also notice that the Indian ocean is generally a little higher that the Atlantic, which is likely due to warmer waters in the Indian ocean. Unlike the Atlantic ocean, which is connected to colder seas near both the north and south poles, the Indian ocean is only connected to colder seas to the south which makes for less mixing with colder waters.
So how did they make the model? The model is based on ocean height measurements from space called satellite radar altimetry, and GPS heights from drifters or ocean buoys on the ocean surface. A total of almost 20 years of height data from 1993 to 2012 was used, in addition to 9 years combined of satellite gravity measurements. To illustrate the measurement at regular intervals, like I mentioned earlier, there is an animation of radar altimetry data from 24 hours of a satellite orbiting the earth below. Repeated over many months and years this pattern will cover much of the world’s oceans and provide repeated measurements in roughly the same place.
That was a quick look at one of the global models of mean DOT. You can find more information about the model on Aviso’s website.
Other Posts in the Series
- GGE6022 – Advanced Topics in Ocean Mapping
- Dynamic Ocean Topography: An Introduction
- Inverse Barometric Effect: A Contribution to Dynamic Ocean Topography
- A Model of Dynamic Ocean Topography (this post)
- What is new in dynamic ocean topography?
- Dynamic Ocean Topography in a Flat Earth Perspective
- Lesson Plan: Dynamic Ocean Topography