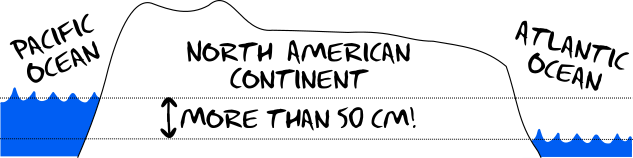
We generally think of the average height of the ocean as being a height of zero. This is because it can be useful to know how far something is above or below sea level, which is a vertical datum. It is a convenient reference height that is easy to access on the ocean or near a coastline. It may surprise you to learn that the height of the Atlantic Ocean on the east coast of North America is more than 50 centimeters (or 20 inches) lower than the height of the Pacific Ocean on the west coast. Only over the last 40 years have we been able to accurately measure these differences in height with the use of satellite altimetry and satellite navigation like GPS, or more generally Global Navigation Satellite Systems (GNSS). These differences in average ocean height across the world’s oceans are commonly referred to as Dynamic Ocean Topography (DOT).
DOT occurs for a number of reasons but the largest factors that cause it are the ocean’s currents, and the ocean’s temperature and salinity. One of the more pronounced examples of DOT is the Gulf Stream Current. In a 100 kilometer cross section of the current there is a height change of around 1 meter. This is referred to as a geostrophic current, the slope of the water arises to create a pressure difference that balances with the coriolis force due to the moving water. Salinity and temperature affect DOT because they control the density of water. When you warm up water it expands; the volume will increase but the mass remains the same. Near the poles there is colder water and near the equator, because of heating from the sun, the water is warmer. This causes the relative height of the water near the equator to be higher than at the poles.
Historically, for most surveying applications we didn’t need to know the absolute height of the oceans. You can set up a tide gauge and get a good estimate of the local mean sea level. And unless you do something crazy (like take that height across a continent, which is the short story behind the Sea Level Datum of 1929) you won’t have to deal with the fact that ocean heights can be different.
More recently, measuring sea surface heights and modeling DOT have proven valuable to understanding global ocean currents (remember geostrophic currents, if there is a slope there is probably a current), improving models of the earth’s gravity field, and to more accurately define continuous vertical datums for use with GNSS/GPS. That last one is where my interest comes in.
My research is related to an investigation of the use of continuous vertical datums for relating GNSS/GPS heights to tidal datums. DOT plays an important role in being able to model the separation not just at single locations, such as tide gauges, but everywhere. This will be the first of a five post series discussing DOT, its importance to mapping, and more details about what causes it.
Additional Resources
If you are curious to learn more here are a couple resources to get you started.
Further Discussion
- Ocean Surface Topography – National Aeronautics and Space Administration (NASA)
- Ocean Surface Topography From Space – Jet Propulsion Laboratory (JPL)
- Mean Dynamic Topography – CNES AVISO+
Published mean models
- DTU10 Mean Dynamic Topography – Technical University of Denmark (DTU) Space
- MDT_CNES-CLS13 Combined mean dynamic topography – CNES AVISO+
- EGM2008 Dynamic Ocean Topography – National Geospatial-Intelligence Agency (NGA)
- 1992-2012/1992-2002 Mean Dynamic Ocean Topography – Asia-Pacific Data Research Center (APDRC)
Near real-time modeling
- Along-Track Near Real-Time Sea Surface Height Anomaly – Jet Propulsion Laboratory (JPL)
- GOFS 3.0 Real-time 1/12° Global HYCOM Nowcast/Forecast System – U.S. Naval Research Laboratory (NRL)
- Data Unification and Altimeter Combination System – Copernicus Marine and Environment Monitoring Service (CMEMS)
Academic resources
- Massachusetts Institute of Technology, Electronics Research Center (US), & Williams College. (1970). The terrestrial environment: solid-earth and ocean physics. National Aeronautics and Space Administration. https://ilrs.cddis.eosdis.nasa.gov/docs/williamstown_1968.pdf
- Fu, L. L., & Chelton, D. B. (2001). Large-scale ocean circulation. In International Geophysics (Vol. 69, pp. 133-viii). Academic Press. https://www.sciencedirect.com/science/article/pii/S0074614201801479
- Albertella, A., Savcenko, R., Bosch, W., & Rummel, R. (2008). Dynamic ocean topography: the geodetic approach. München: IAPG, Techn. Univ. http://www.iapg.bgu.tum.de/mediadb/36070/36071/iapg_fesg_rpt_27.pdf
- Marchenko, A., Tretyak, K., Lopyshansky, A., & Pavliv, T. (2010). Recent dynamic ocean topography models and their comparison. Infrastruktura i Ekologia Terenów Wiejskich, (11). http://agro.icm.edu.pl/agro/element/bwmeta1.element.dl-catalog-96116264-ca30-44a0-9383-c813fe637136/c/Marchenko.pdf
- Andersen, O., Knudsen, P., & Stenseng, L. (2015). The DTU13 MSS (mean sea surface) and MDT (mean dynamic topography) from 20 years of satellite altimetry. In IGFS 2014(pp. 111-121). Springer, Cham. https://link.springer.com/chapter/10.1007/1345_2015_182
Other Posts in the Series
- GGE6022 – Advanced Topics in Ocean Mapping
- Dynamic Ocean Topography: An Introduction (this post)
- Inverse Barometric Effect: A Contribution to Dynamic Ocean Topography
- A Model of Dynamic Ocean Topography
- What is new in dynamic ocean topography?
- Dynamic Ocean Topography in a Flat Earth Perspective
- Lesson Plan: Dynamic Ocean Topography
1 thought on “Dynamic Ocean Topography: An Introduction”
Comments are closed.